Skip to content
Holland Bloorview Impact Report 2025
Menu
Impact Stories
Personalizing health
Advancing health equity
Leading with a world-class team
Investing in access and innovation
Highlights
Quick hits
Newsmakers
Awards
Financials
PDF Reports
Hospital
Foundation
DONATE
Search for:
Financials
Holland Bloorview Hospital
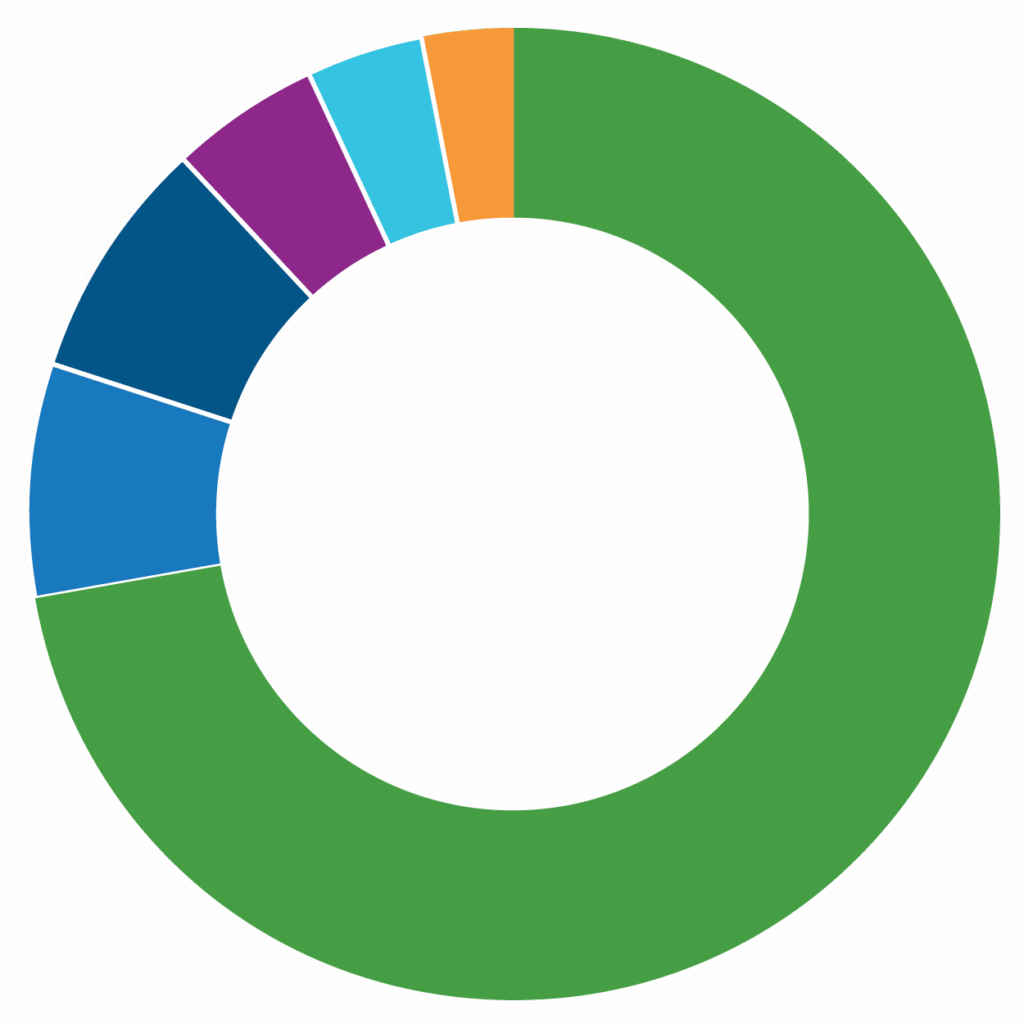
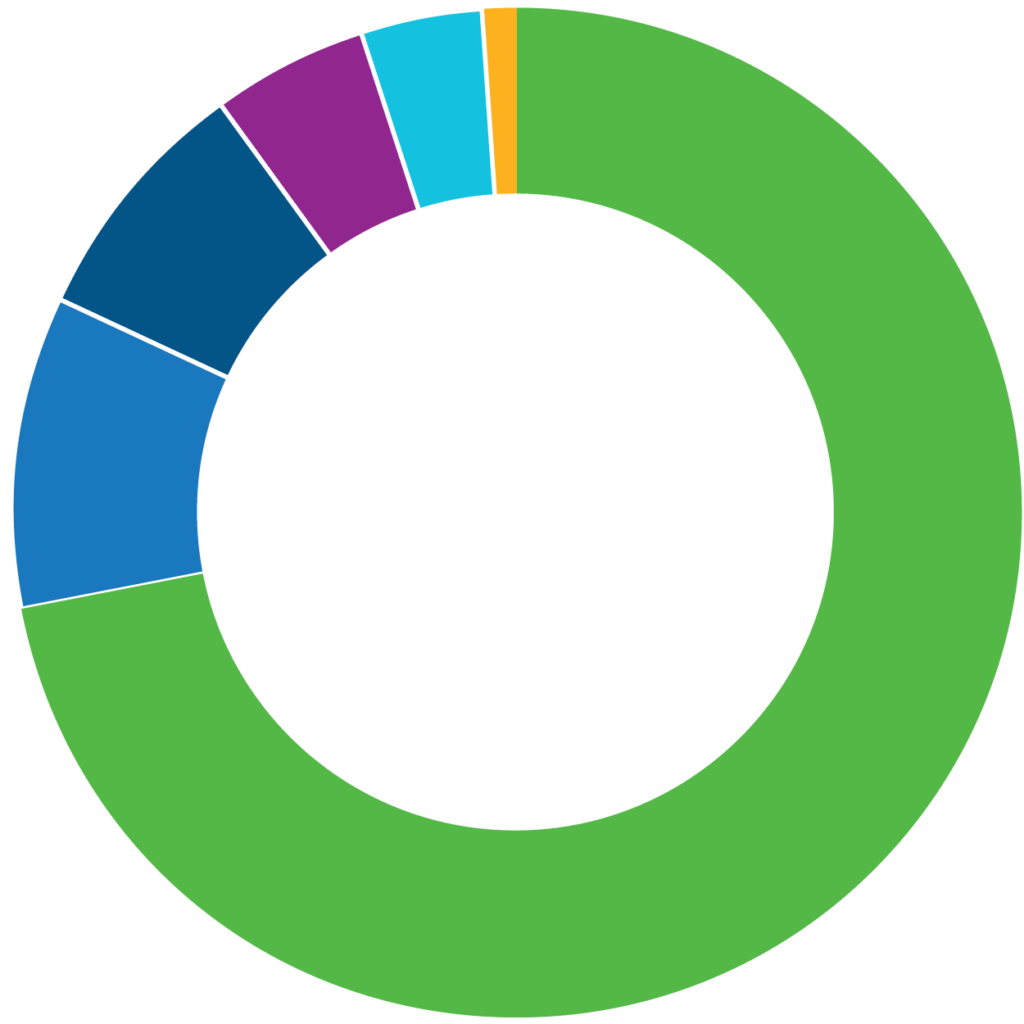
Where do hospital funds come from?
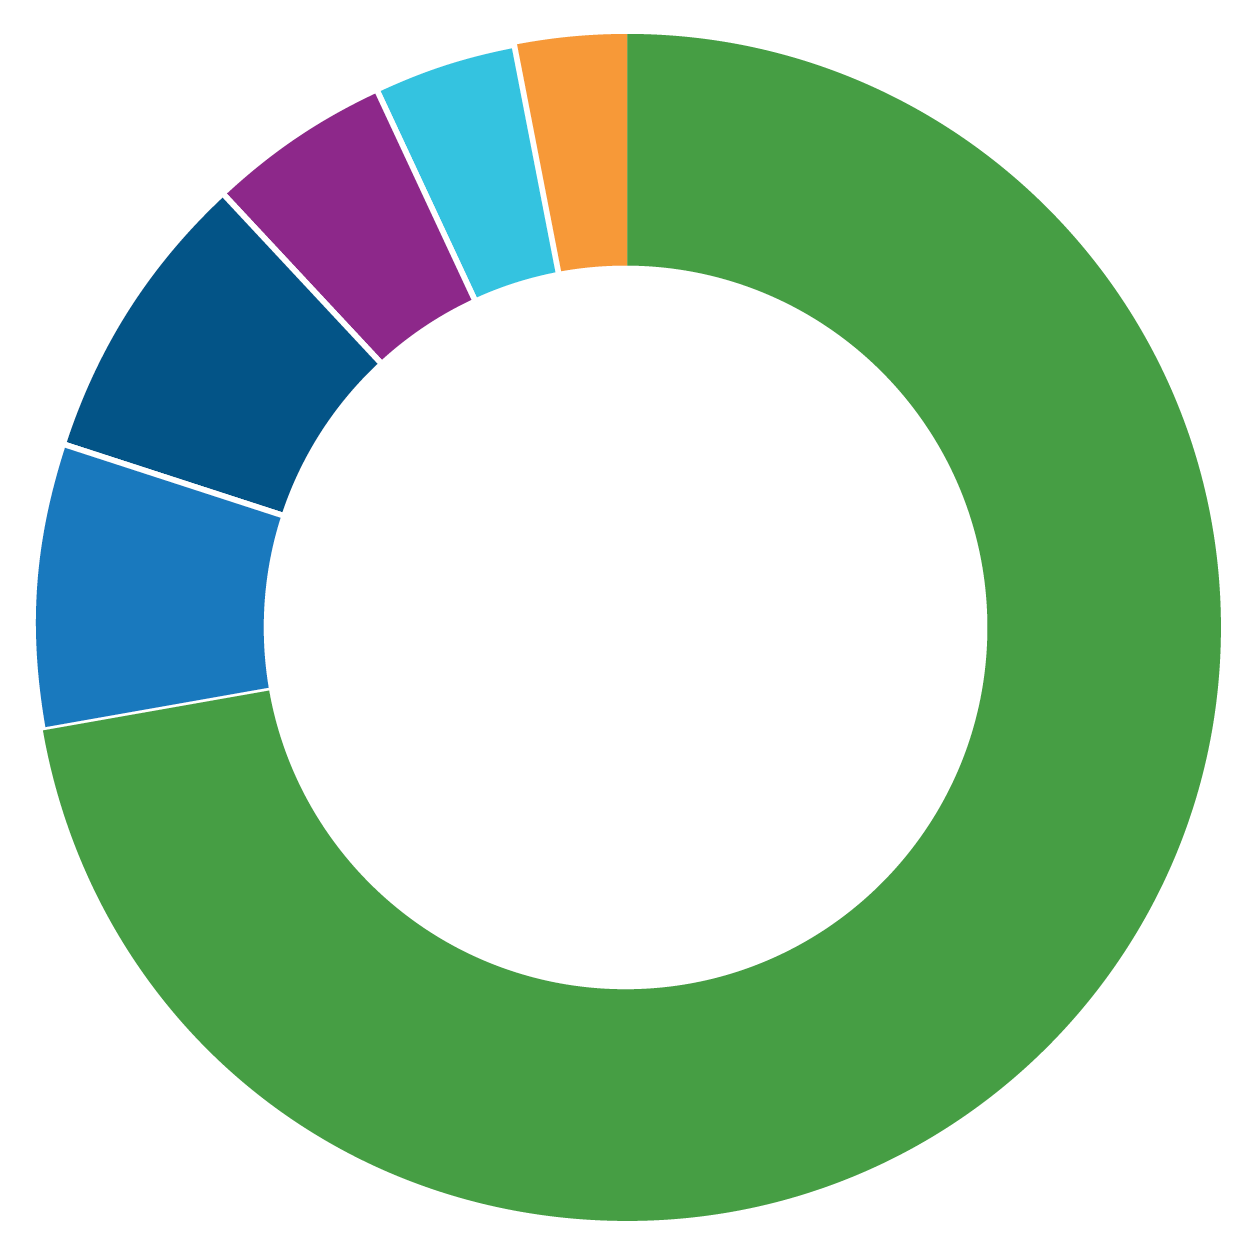
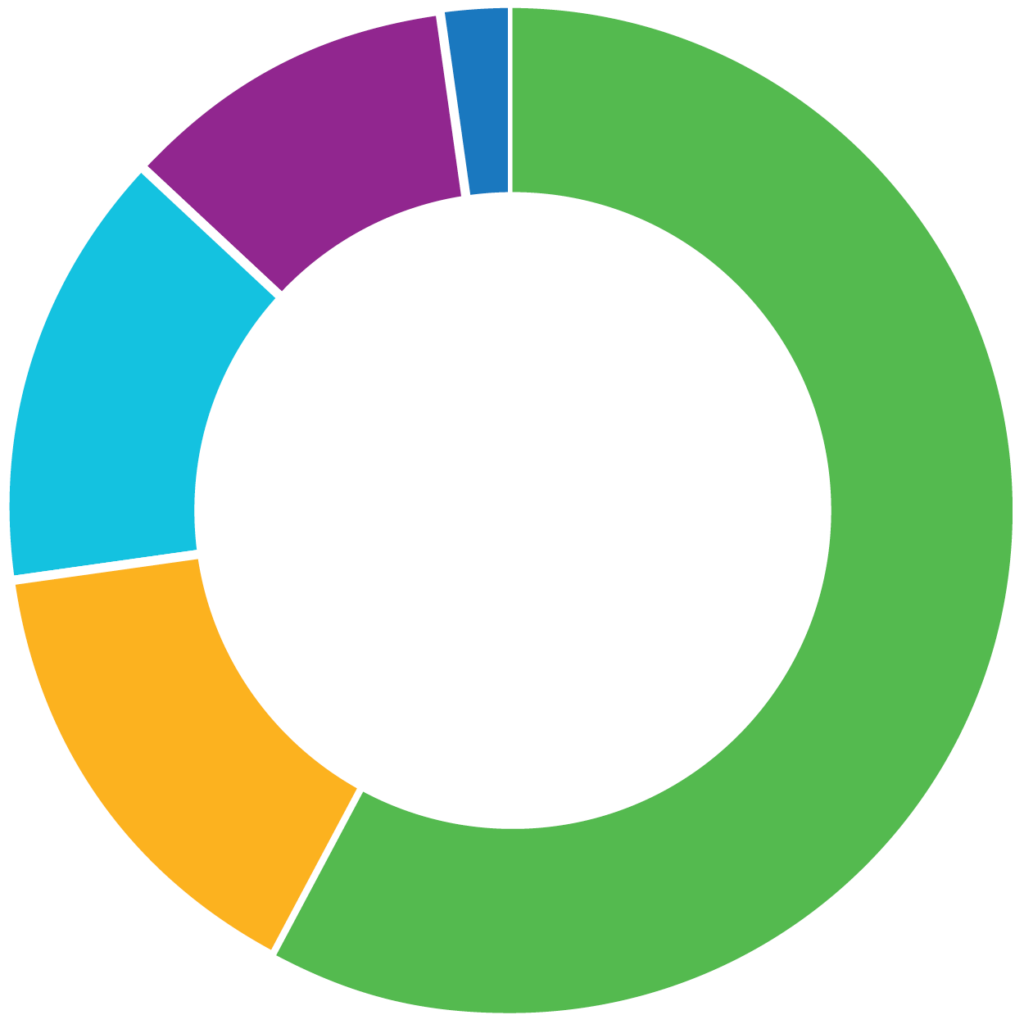
How do we spend hospital funds?
73%
Government
8%
Donors
8%
Client services
5%
Research
4%
Commercial ventures
3%
Investments
59%
Care
15%
Administration
15%
Clinical and client support
10%
Research
1%
Professional development
Where do hospital funds come from?
73%
Government
7%
Donors
8%
Client services
5%
Research
4%
Commercial ventures
3%
Investments
How do we spend hospital funds?
59%
Care
15%
Administration
15%
Clinical and client support
10%
Research
1%
Professional development
View our full 2023-2024 financial statements on
our website
.
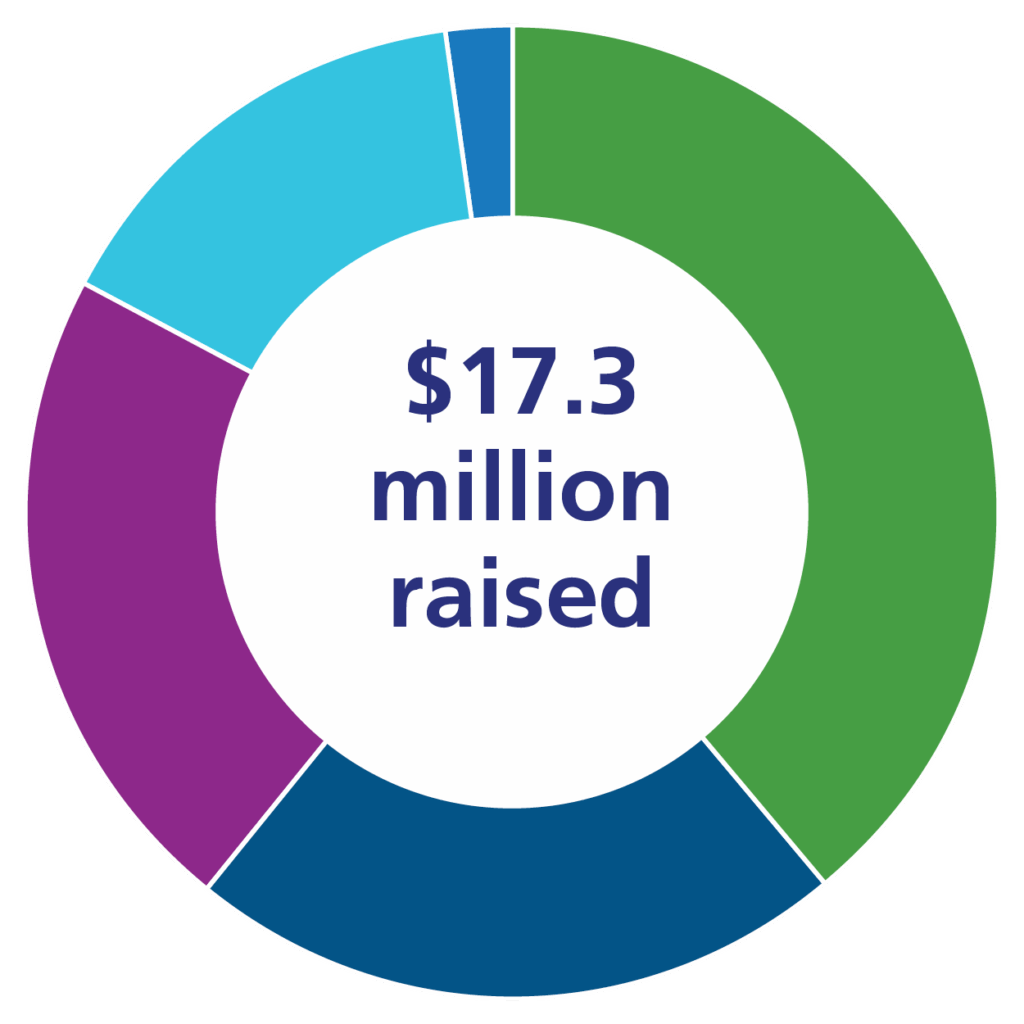
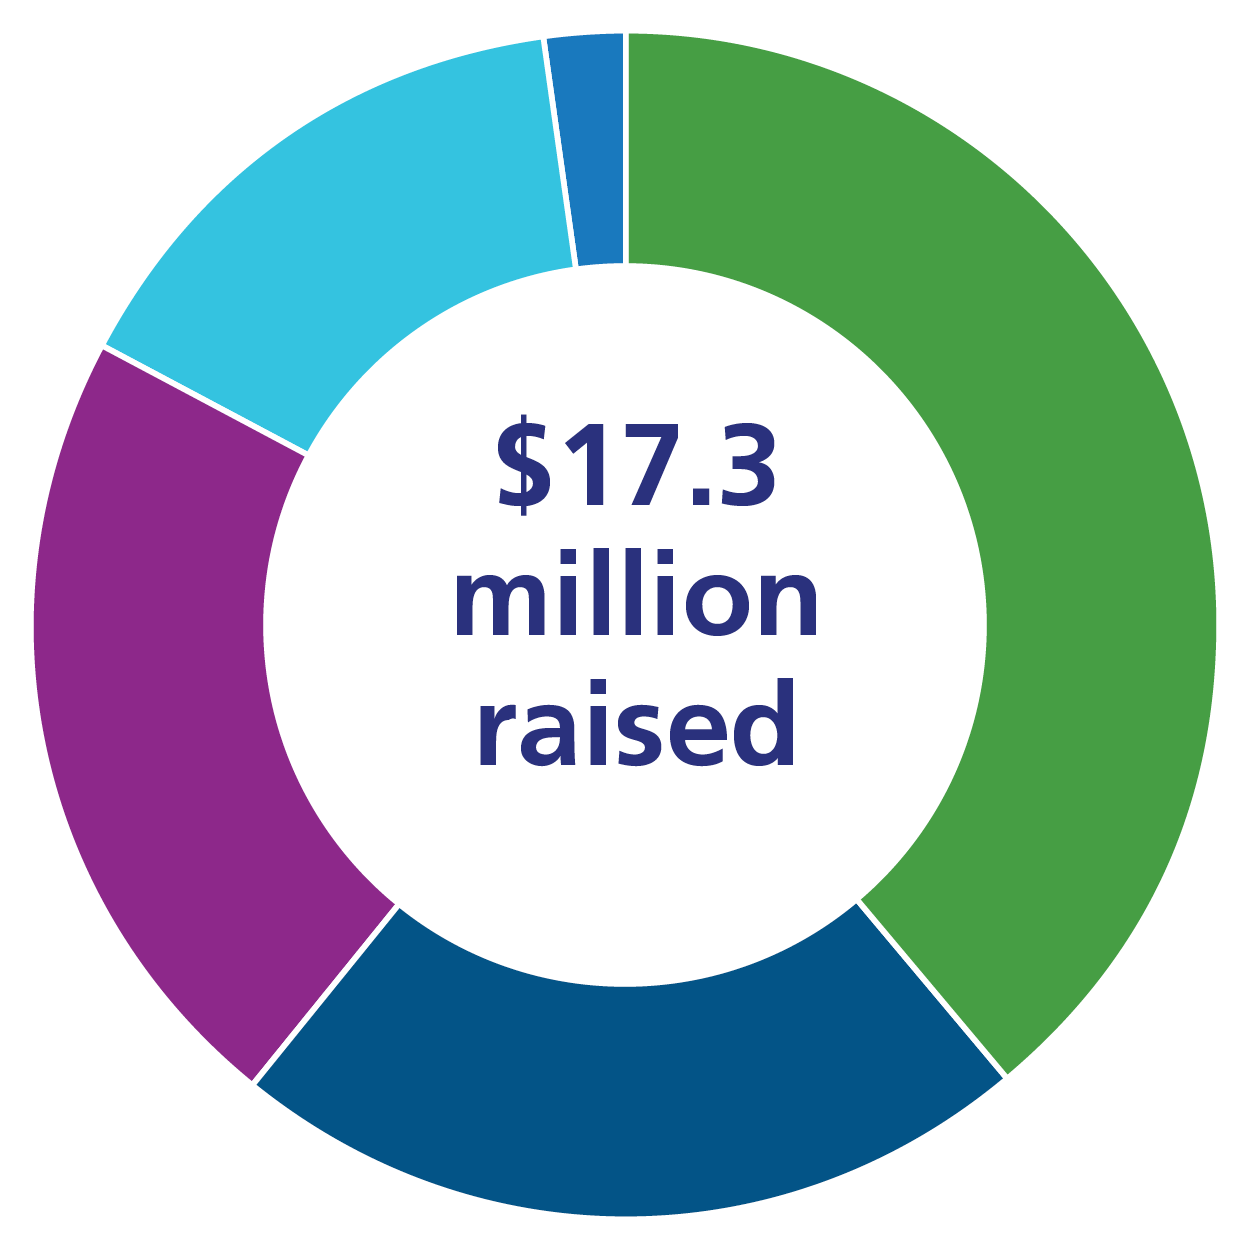
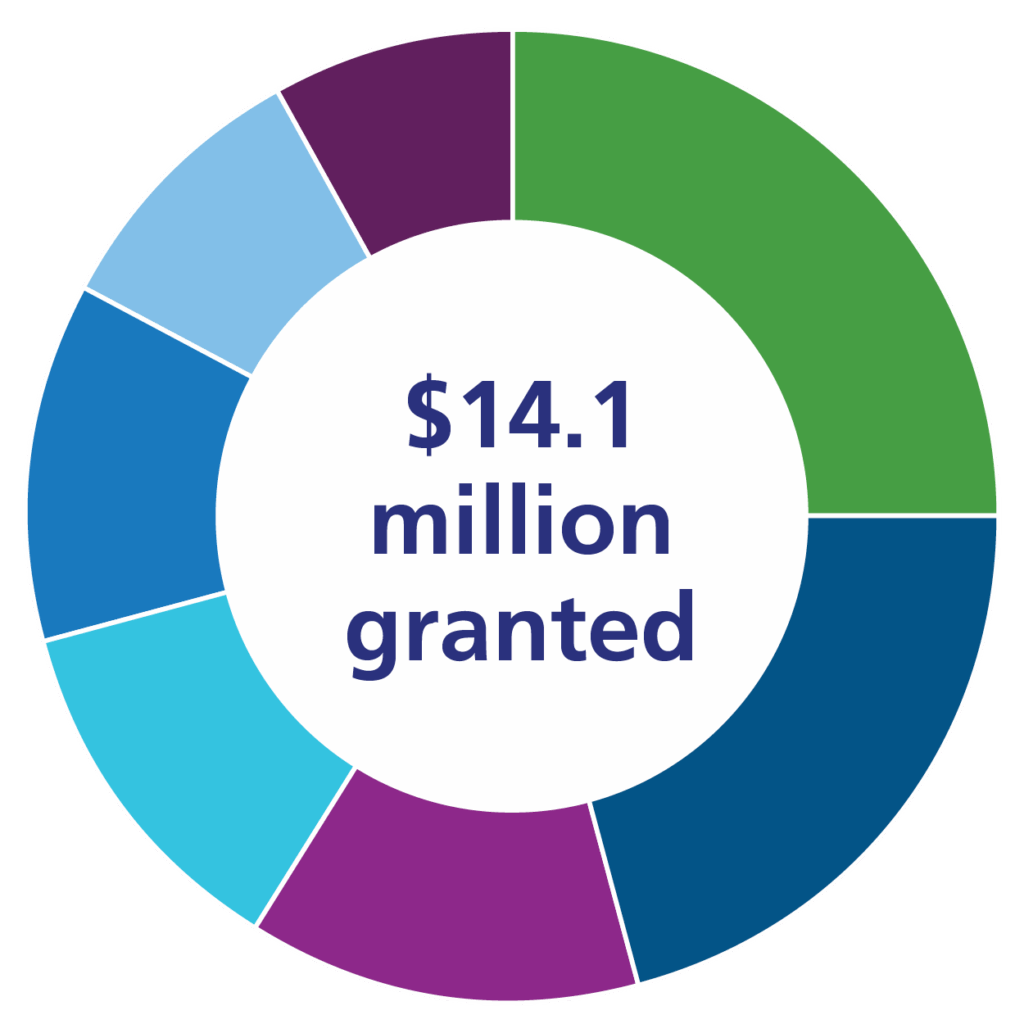
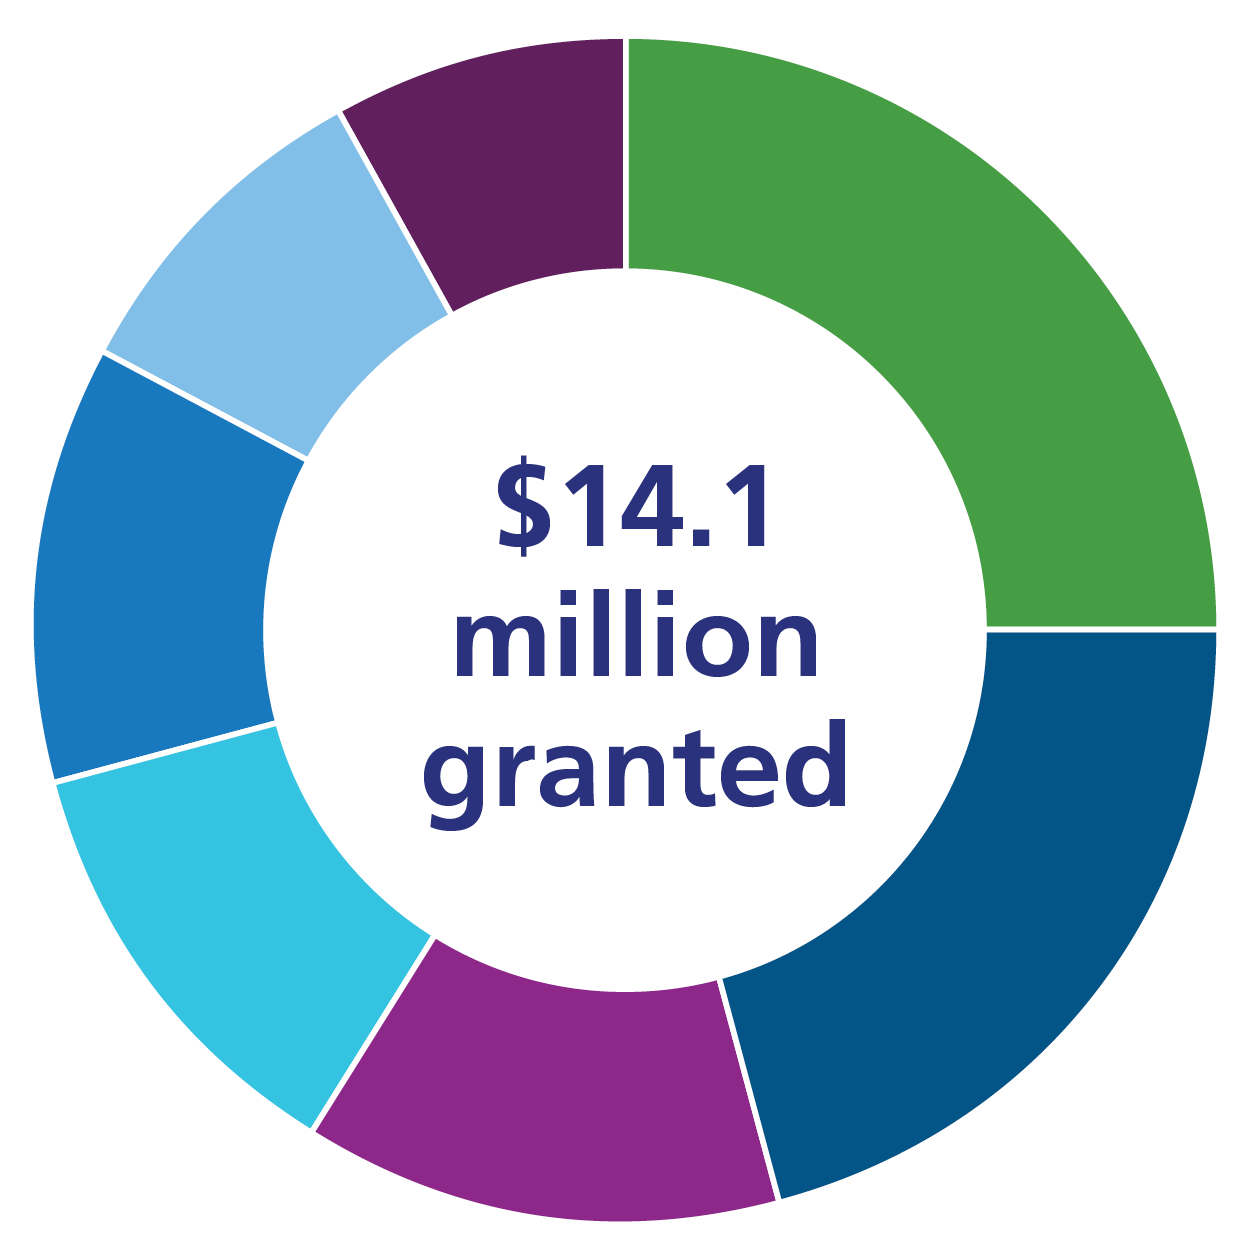
Holland Bloorview Foundation
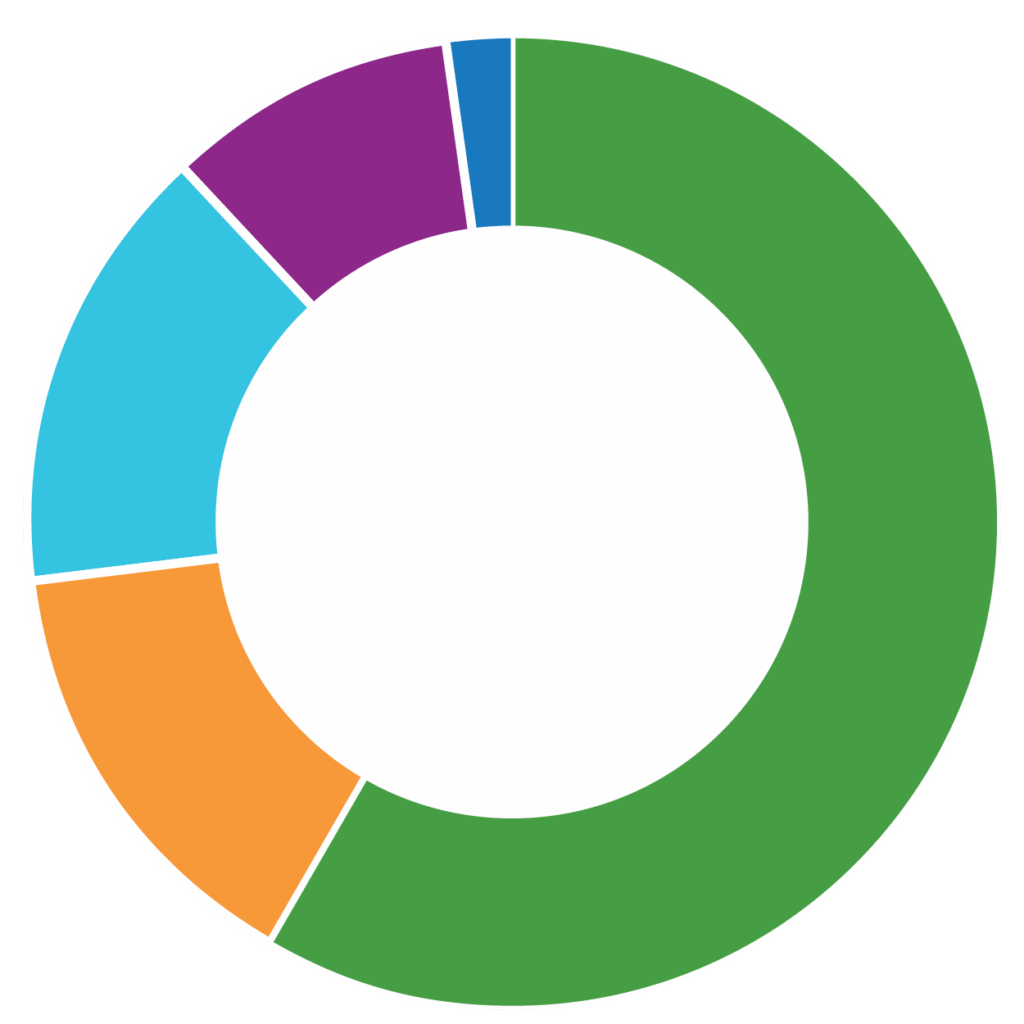
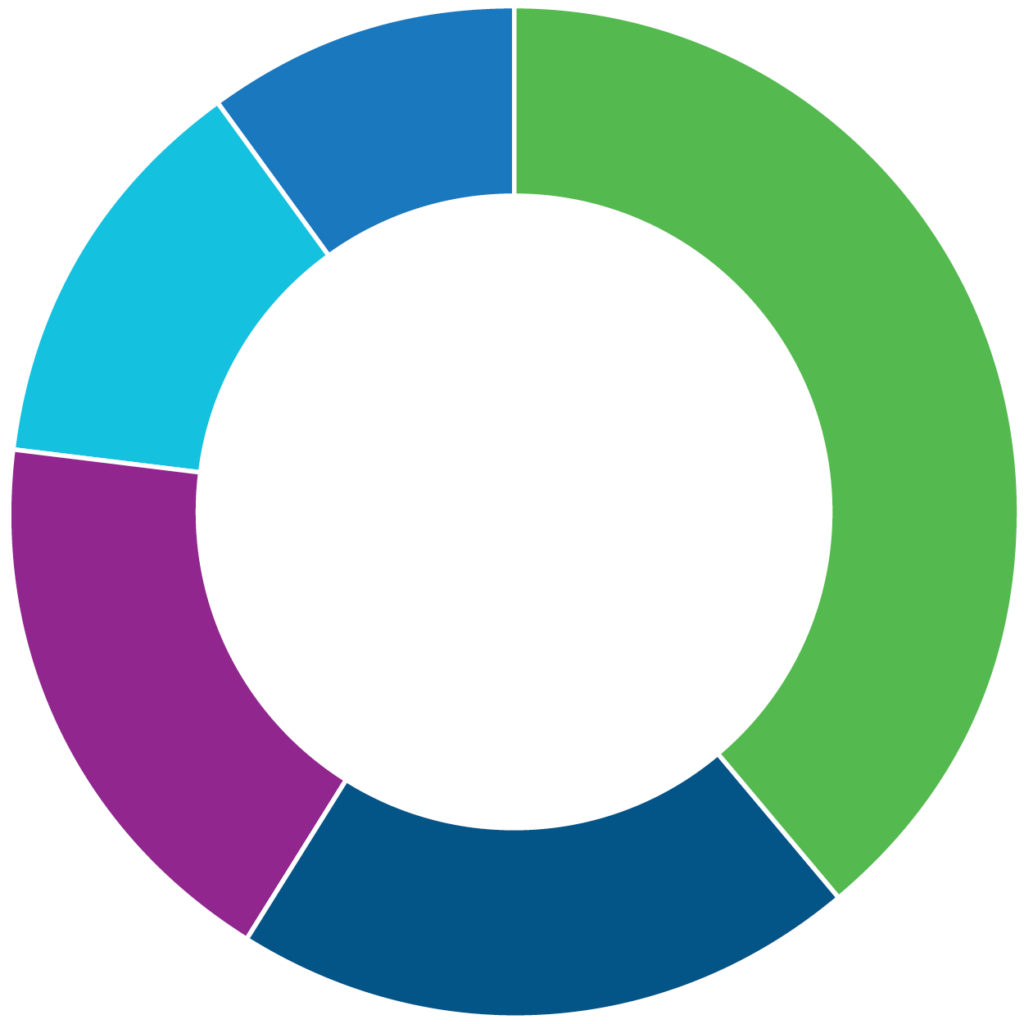
Where do foundation funds come from?
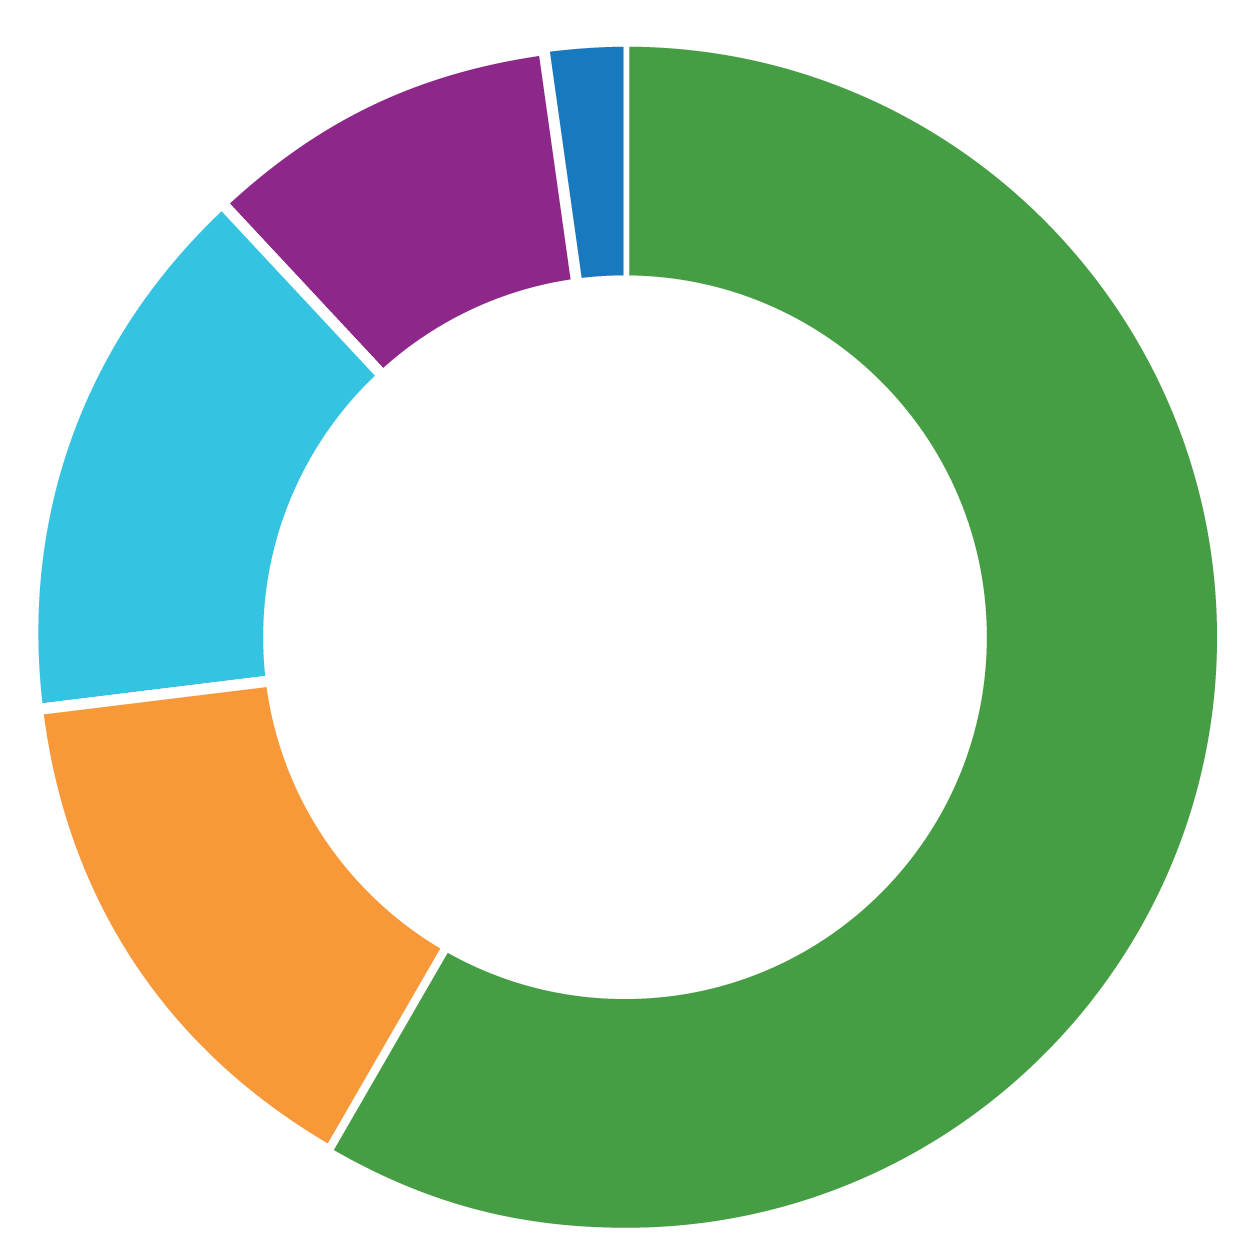
How do we grant foundation funds?
39%
Individuals
22%
Corporations
22%
Foundations
15%
Special events
2%
Bequests
25%
Research
21%
Client & family Integrated Care
13%
Research institute core funding
12%
Community resources
12%
Participation & inclusion
9%
Teaching & learning
8%
BRI Growth strategy
Where do foundation funds come from?
39%
Individuals
22%
Corporations
22%
Foundations
15%
Special events
2%
Bequests
How do we grant foundation funds?
25%
Research
21%
Client & family Integrated Care
13%
Research institute core funding
12%
Community resources
12%
Participation & inclusion
9%
Teaching & learning
8%
BRI Growth strategy
View our full 2023-2024 financial statements on
our website
.
At Holland Bloorview Foundation, we are grateful for every donation that is helping to create a world of possibilities for kids with disabilities.
Donor list for 2024-2025
Bloorview Research Institute
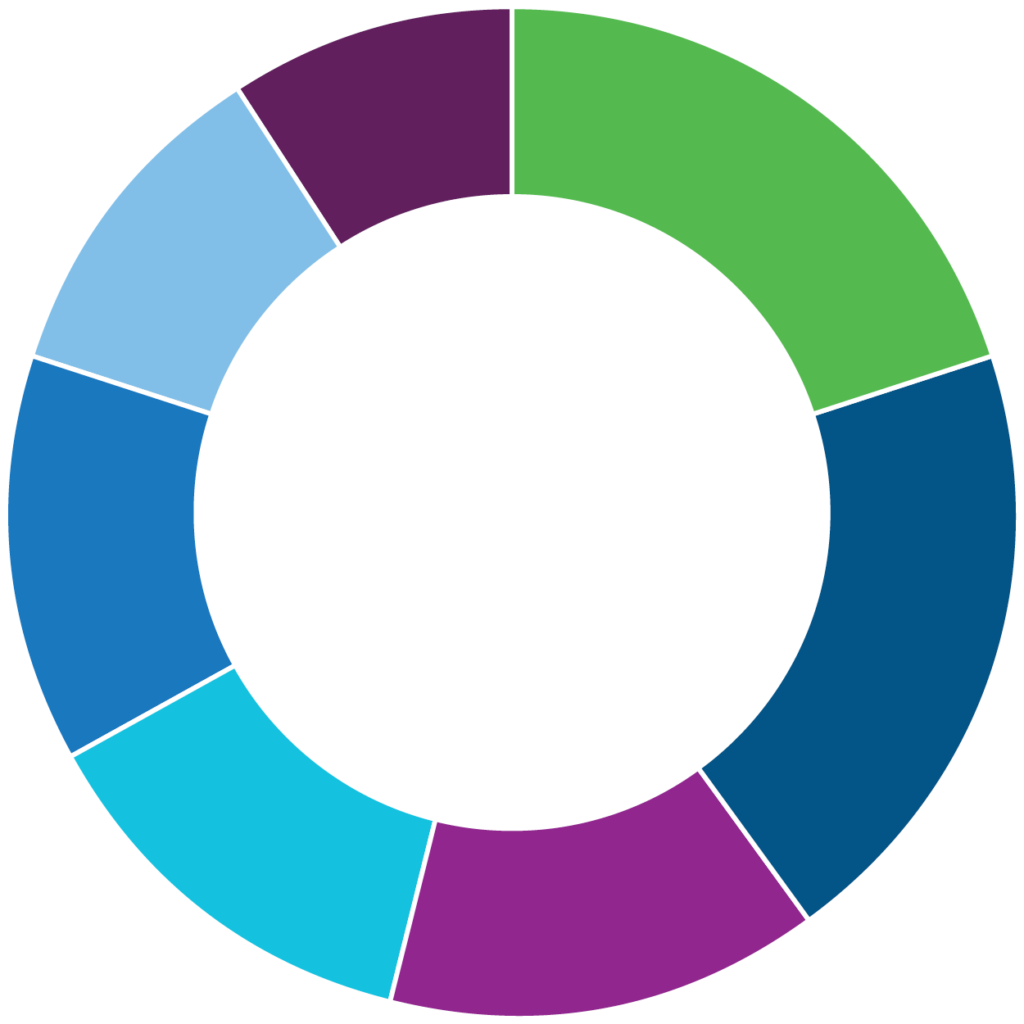
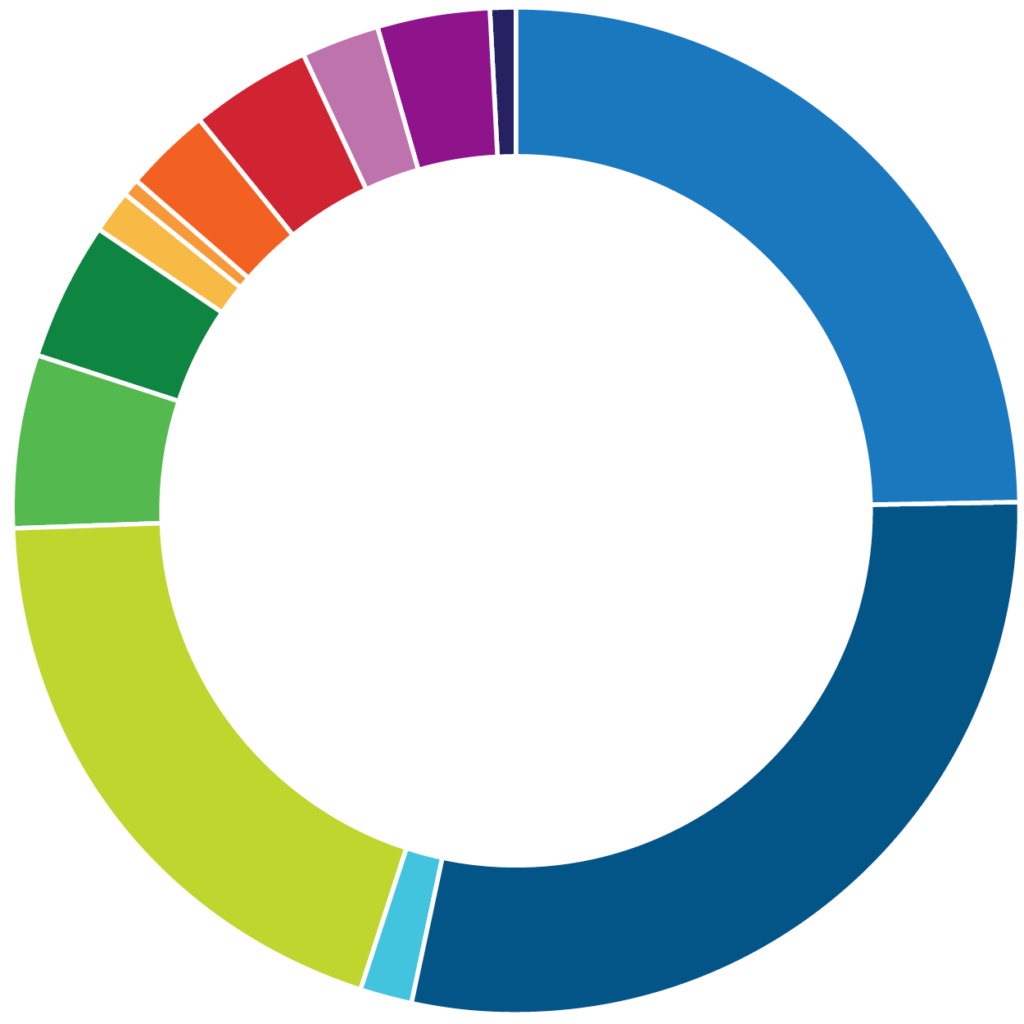
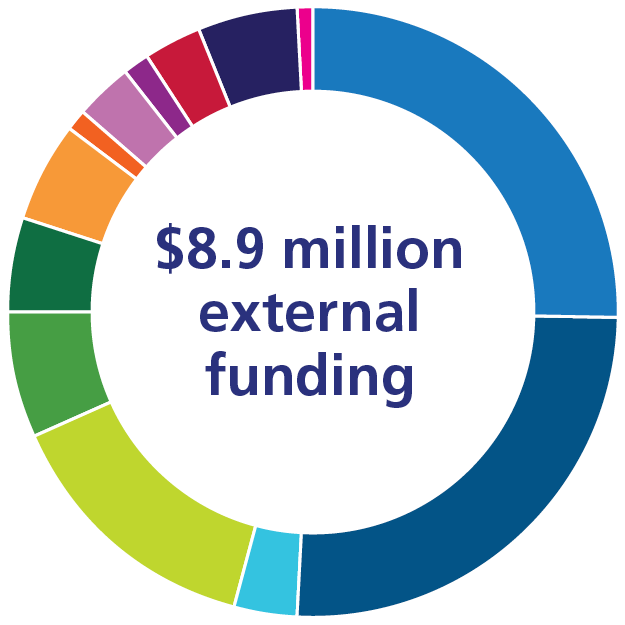
Where do research funds come from?
25.5%
Tricouncil
25.3%
Provincial
3.4%
Subgrants collaboration
14.1%
Donation
6.8%
Indirect
4.9%
Scientist awards
5.3%
Federal
1.2%
International
2.9%
Industry
1.5%
Other peer reviewed
2.9%
Studentship
5.3%
National association/foundation
0.8%
Royalties/other revenue
25.5%
Tricouncil
25.3%
Provincial
3.5%
Subgrants collaboration
14.1%
Donation
6.8%
Indirect
4.9%
Scientist awards
5.3%
Federal
1.2%
International
2.9%
Industry
1.5%
Other peer reviewed
2.9%
Studentship
5.3%
National association/foundation
0.8%
Royalties/other revenue
Total external funding received: $7.4 million